
Between 2016 and 2023, compliance workloads at large US financial institutions increased by 61%, according to the Bank Policy Institute, while overall employee hours grew by just 20% and the share of IT budgets allocated to compliance climbed from 9.6% to 13.4%.
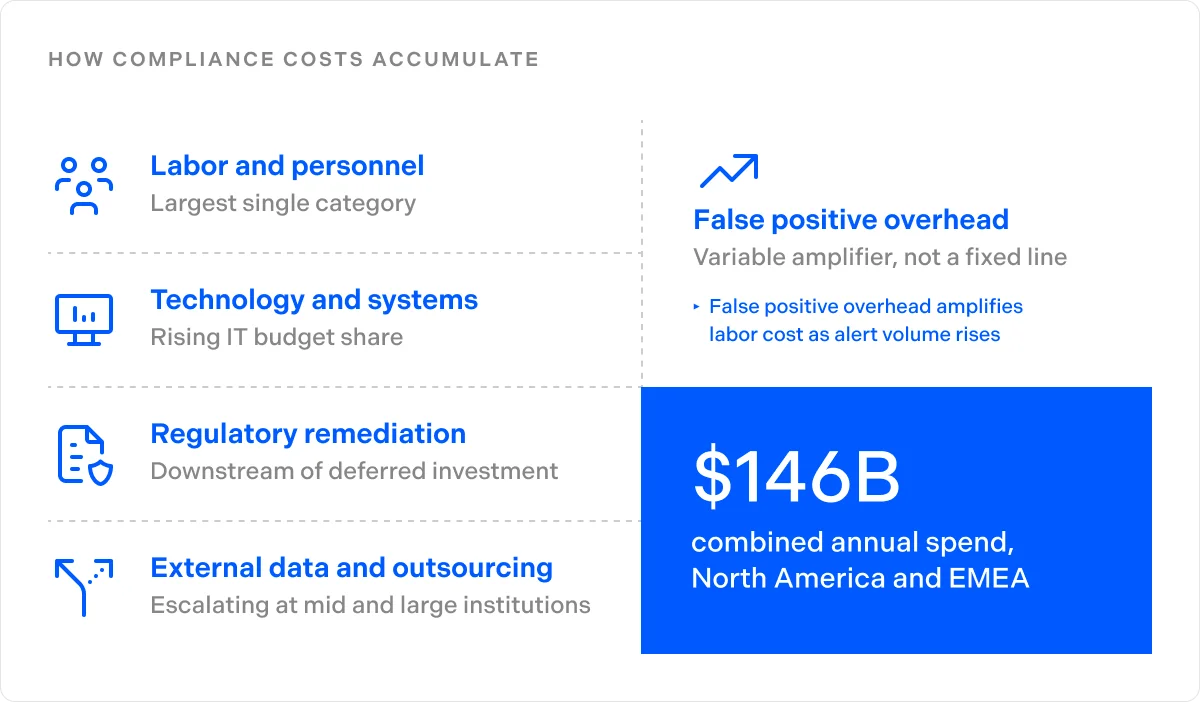
Without a clear picture of where that spend is concentrated, institutions keep expanding their compliance teams to absorb a problem that, across the US, Canada, and EMEA, adds up to $146 billion annually. The majority of this outlay goes toward labor processing work that a better-calibrated program would not produce.
This guide explains what drives the cost of financial crime compliance, where most programs lose expenses they could recover, and how to reduce that burden without compromising detection or regulatory standing.
Key takeaways:
- FCC costs fall across five distinct categories
Labor, technology, regulatory remediation, external data, and false positive overhead each carry different drivers and different reduction opportunities.
- False positives are a cost problem, not just an accuracy problem
Most analyst time at institutions running legacy screening systems goes toward alerts that produce no action, making false positive volume one of the largest drivers of compliance labor spend.
- Indirect compliance costs routinely exceed the fine
Consent orders, remediation programs, reputational damage, and business restrictions accumulate in ways that rarely appear in compliance budgets but can run far beyond the headline fine.
- EMEA and North America are on opposite enforcement trajectories
Rising regulatory pressure in Europe and a proportionality debate in North America mean the cost environment looks very different depending on where an institution operates.
- Sigma360 reduces compliance costs where the spend is most recoverable
By addressing alert triage, investigation overhead, and fragmented tooling in one platform, Sigma360 helps compliance teams cut the labor burden that accounts for the majority of FCC operating spend.
What drives the cost of financial crime compliance
The financial crime compliance cost base spans five distinct categories, each with its own drivers and reduction opportunities. The table below maps what drives each and lists the available evidence on scale.
| Cost category | Primary drivers | Scale indicators |
| Labor and personnel | Alert review, case investigations, SAR writing, KYC refresh, EDD | 78% of small financial institutions reported higher labor cost increases than their mid and large counterparts |
| Technology and systems | AML platforms, screening tools, data feeds, case management, infrastructure | IT compliance budget share rose from 9.6% (2016) to 13.4% (2023) |
| Regulatory remediation | Consent orders, monitor fees, enhanced supervision programs, asset caps | October 2024 enforcement actions against TD Bank across DOJ, FinCEN, OCC, and the Federal Reserve totaled $3.09 billion |
| External data and outsourcing | Sanctions lists, adverse media feeds, corporate registry data, KYC vendor costs | Mid and large institutions report higher cost escalations for external data and outsourcing than for internal technology |
| False positive overhead | Manual review of irrelevant alerts, duplicate case files, analyst time on no-action outcomes | False positive rates in legacy AML systems run at 90–95%, meaning the majority of analyst alert-handling time produces no finding |
False positive volume is the most direct amplifier of labor cost; no cost category operates independently. When alert queues exceed analyst capacity, institutions hire to absorb the load rather than fix the underlying calibration.
Legacy systems that require custom integrations push technology spend higher across successive budget cycles.
Regulatory remediation, the most visible category, is almost always the downstream consequence of programs that deferred investment in controls and later paid a multiple of that cost in enforcement.
Direct costs vs. indirect costs
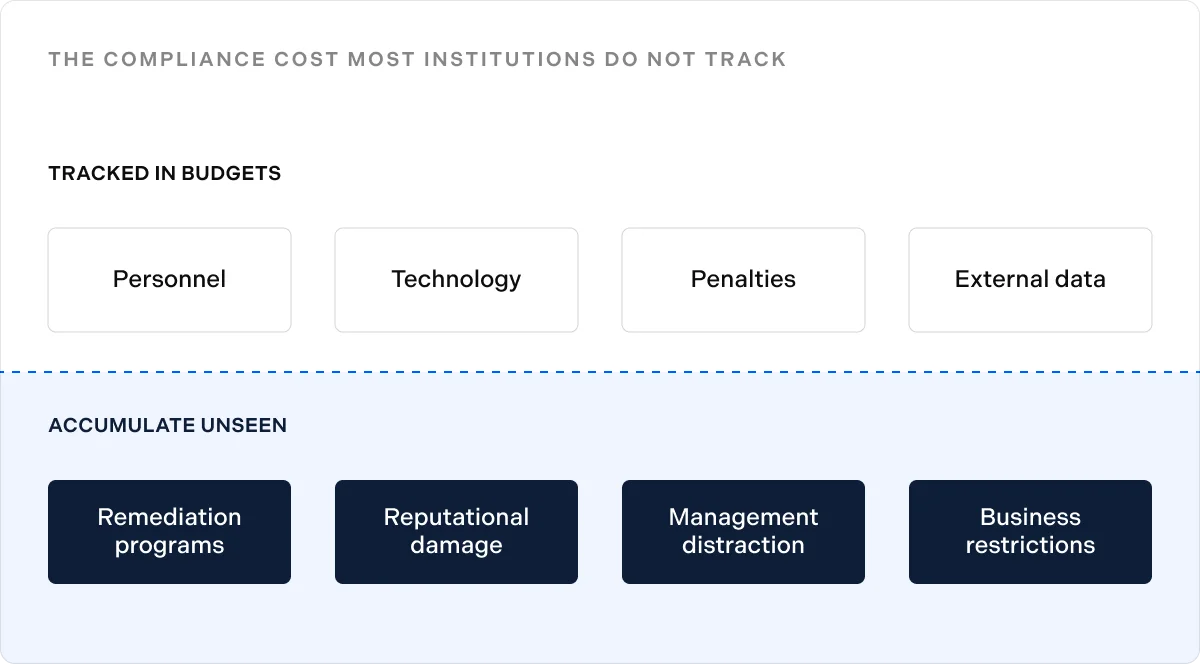
Direct FCC costs appear in budget lines and get tracked, while indirect costs accumulate in the background and, in most enforcement cases, end up larger.
Direct costs include:
- Personnel: Salaries, benefits, and training for compliance analysts, investigators, and management
- Technology: Platform licensing, infrastructure, and maintenance for AML and screening systems
- Regulatory penalties: Fines, disgorgement, and civil monetary penalties imposed by regulators
- External data: Fees for sanctions lists, adverse media sources, corporate registry access, and KYC vendors
Indirect costs are the consequences of compliance failures or program inefficiency and include:
- Remediation programs: Consent order requirements, independent monitor costs, and enhanced supervision infrastructure
- Reputational damage: Lost correspondent banking relationships, customer attrition, and credit rating downgrades
- Management distraction: Executive time consumed by regulatory inquiries, congressional hearings, and enforcement negotiations
- Business restrictions: Operational limitations imposed by regulators that slow product launches and market expansion
The OCC’s October 2024 enforcement action against TD Bank illustrates how far the indirect exposure can reach. A $450 million OCC civil penalty and an asset cap on US growth, alongside a $1.3 billion FinCEN civil penalty imposed the same day.
The total regulatory settlement across all agencies reached $3.09 billion.
The false positive problem as a cost driver
At legacy alert volumes, per-analyst triage costs for manual alert review run between $1,500 and $4,000 per month, depending on institution size, jurisdiction, and complexity. Across a compliance function handling thousands of alerts per week, the cost of clearing false positives consumes the majority of total labor spend while contributing nothing to genuine risk detection.
When screening thresholds are calibrated too broadly, alert queues grow faster than headcount can absorb them. Institutions respond by hiring, which increases fixed costs, or by raising thresholds further, which creates coverage risk.
Both responses treat the symptom rather than the source, and both defer the cost to a different budget line.
Adverse media and sanctions screening false positives are among the most recoverable cost drivers in a compliance program. Better entity resolution and AI-assisted triage address both without touching coverage or regulatory standing.
Read more: Why leading financial institutions are replacing legacy compliance
How FCC costs vary by institution size
Compliance costs do not scale evenly across institution types. Where the spend concentrates and what drives it differs significantly between smaller banks and their mid and large counterparts.
Smaller banks (those with under $10 billion in assets) face a proportionally heavier burden: 87% reported higher screening alert volumes in the past year, according to Forrester Consulting research.
The financial crime compliance framework a smaller institution runs takes a disproportionate share of fixed technology costs relative to its size, which means alert volume creates more direct pressure on both budget and capacity than it does at larger peers.
Mid and large institutions face a different pressure point. 83% reported higher screening alert volumes, and 82% experienced higher escalations in KYC software costs, with 79% seeing the same in external outsourcing, according to the same research.
Scaling third-party data relationships and compliance technology contracts is where large-institution spend concentrates, even when their per-employee compliance cost is proportionally lower.
Both institution types carry recoverable inefficiency. The AI in financial crime compliance approaches that reduce alert volume and accelerate investigations address cost drivers across both, though smaller institutions tend to see faster returns on alert triage while larger ones recover more from investigation workflow automation.
The regional cost divergence: EMEA vs. North America
In North America, AML, KYC, sanctions, and CDD penalties fell 58% year over year in 2025, according to global enforcement data reported by Fintech Global. FinCEN’s September 2025 request for information on AML compliance costs for non-bank financial institutions reflects a policy environment actively questioning the proportionality of compliance spend relative to its outcomes.
In EMEA, on the other hand, enforcement penalties rose 767% year over year in 2025, driven largely by the conclusion of long-running investigations and intensified scrutiny in specific sectors.
The EU’s Anti-Money Laundering Regulation (AMLR), applying directly across all member states from July 10, 2027, introduces harmonized customer due diligence standards, a 25% UBO threshold, and direct supervision of the largest obliged entities.
Oxford Economics research puts the UK’s annual financial crime compliance bill alone at £38.3 billion (equivalent to Estonia’s GDP), confirming that the burden in European markets extends well beyond headline enforcement figures.
European institutions cannot treat rising compliance costs as cyclical. The AMLR deadline, the activation of AMLA’s supervisory powers, and 2025 penalty data all reinforce the same trajectory.
North American institutions face a different but equally demanding shift, as FinCEN moves toward effectiveness-based standards that will require evidenced program outcomes rather than documented controls.
How to reduce the cost of financial crime compliance
The most recoverable spend concentrates in three operational areas:
1. Alert triage and false positive clearance
False positive clearance consumes a disproportionate share of analyst capacity in most compliance programs. Machine learning models can clear obvious false positives autonomously, directing human review to the alerts that warrant it.
Sigma360’s Match Agent reduces manual match reviews by 90%, translating directly into analyst hours recovered and costs reduced.
2. Investigation workflows
Analysts building a SAR case spend hours pulling data from multiple systems, cross-referencing ownership structures, and drafting investigation narratives from scratch. Sigma360’s AML investigations software generates AI-powered entity summaries that bring together watchlist status, registry data, adverse media, and KYC records into one structured view before analysis begins, reducing the time spent on data assembly without compromising the depth of the investigation.
3. Fragmented tooling
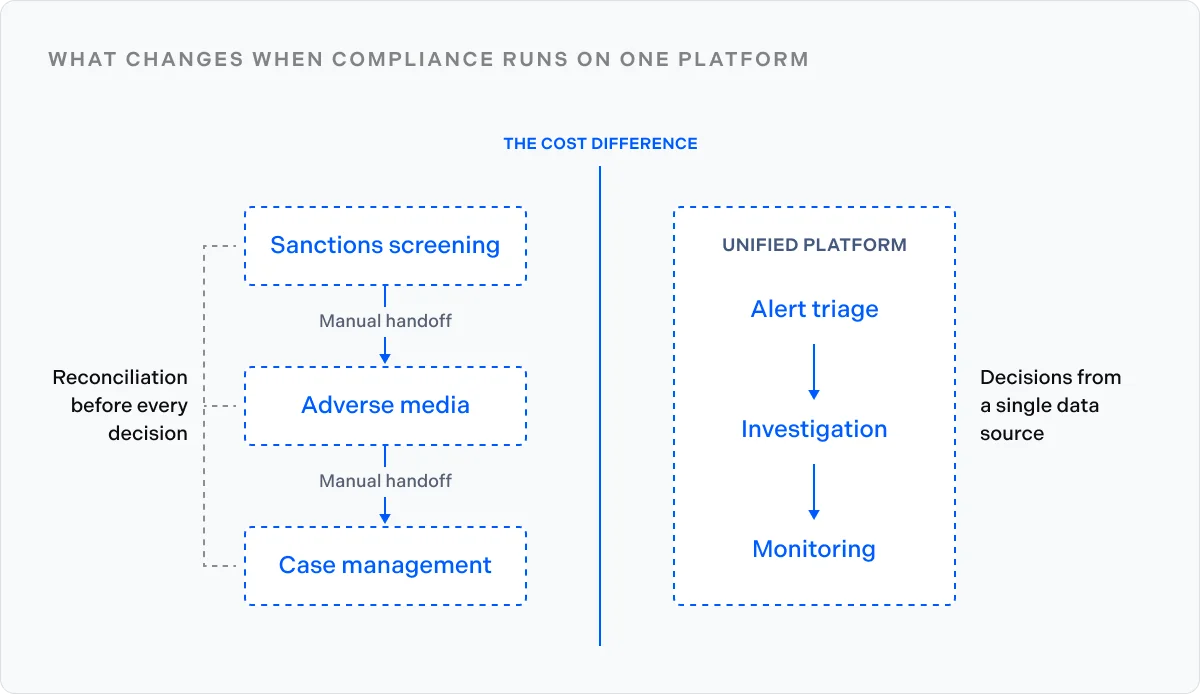
Separate platforms for sanctions data, adverse media, PEP status, and corporate registry information force analysts to spend time reconciling records across systems before any assessment can begin.
That time accumulates across every case without producing a single risk decision. A unified financial crime risk management platform eliminates the duplicate sourcing that drives both labor cost and error rate.
Global payments firm cuts $1M in annual screening costs
Addressing alert triage and investigation workflows together, rather than in isolation, is where the most significant cost reductions occur. A global payments company with a high-volume screening portfolio partnered with Sigma360 to automate both, with measured results across the live production environment:
- 93.3% of false positives cleared automatically, with no analyst involvement
- Manual review burden reduced enough to project $1 million in annual cost savings
- Screening coverage maintained across the full portfolio without adding headcount
How Sigma360 reduces the cost of financial crime compliance
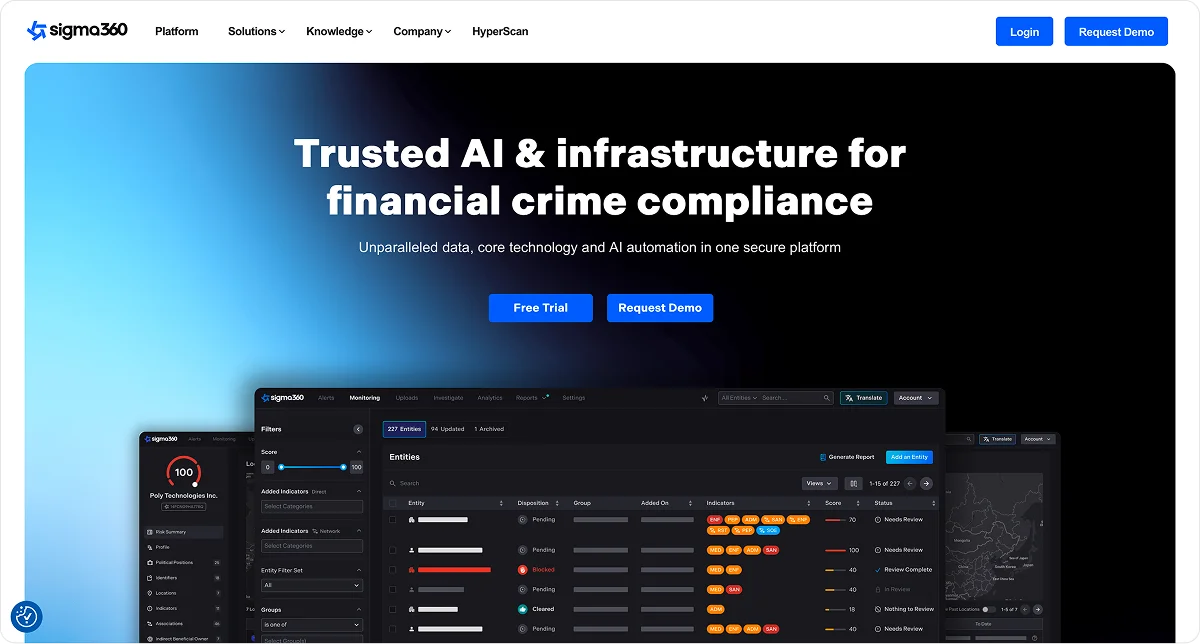
Sigma360 is a full-stack AI platform for risk intelligence, financial crime prevention, and compliance, bringing global risk data, proprietary intelligence, core screening technology, and AI automation into one environment.
Where most programs accumulate cost through disconnected tools and manual workflows, Sigma360 is designed to reduce the alert volume, investigation overhead, and reconciliation work that drive the majority of FCC labor spend. Clients report up to 93% fewer false positives in production.
Key capabilities that directly reduce compliance operating costs include:
- Match Agent automates false positive clearance on sanctions and watchlist screening alerts, cutting manual match reviews by 90% and redirecting analyst time toward genuine risk
- Adverse Media Summary groups related adverse media articles by impact level and match strength into a single auditable narrative, replacing hours of article-by-article triage
- Entity Summary assembles watchlist status, registry data, adverse media, and KYC records into a single pre-investigation profile, removing the data-sourcing phase that typically consumes the first hour of every case
- Perpetual KYC monitors the full customer portfolio continuously, replacing scheduled review cycles and the labor cost of periodic refresh programs
Request a demo to see how Sigma360 applies to your compliance cost structure.
FAQ
How much do financial institutions spend on financial crime compliance?
Financial institutions in the US and Canada spend $61 billion annually, with EMEA institutions absorbing a further $85 billion, according to Forrester Consulting research. Personnel costs account for the majority of that total at most institutions.
What is the biggest cost driver in AML compliance?
Labor is the dominant cost category, driven by manual alert review against a backdrop of 90–95% false positive rates in legacy screening systems. Most analyst time goes toward clearing alerts that produce no finding rather than investigating genuine risk.
Is non-compliance more expensive than building a strong program?
In most documented enforcement cases, yes. The October 2024 regulatory settlement against TD Bank totaled $3.09 billion across four agencies.
Will the EU’s AMLR increase compliance costs for European institutions?
The AMLR, applying across all member states from July 10, 2027, requires harmonized CDD standards and a 25% UBO threshold that most institutions will need to reconfigure programs to meet. Institutions operating across multiple EU jurisdictions face the most significant implementation investment.

